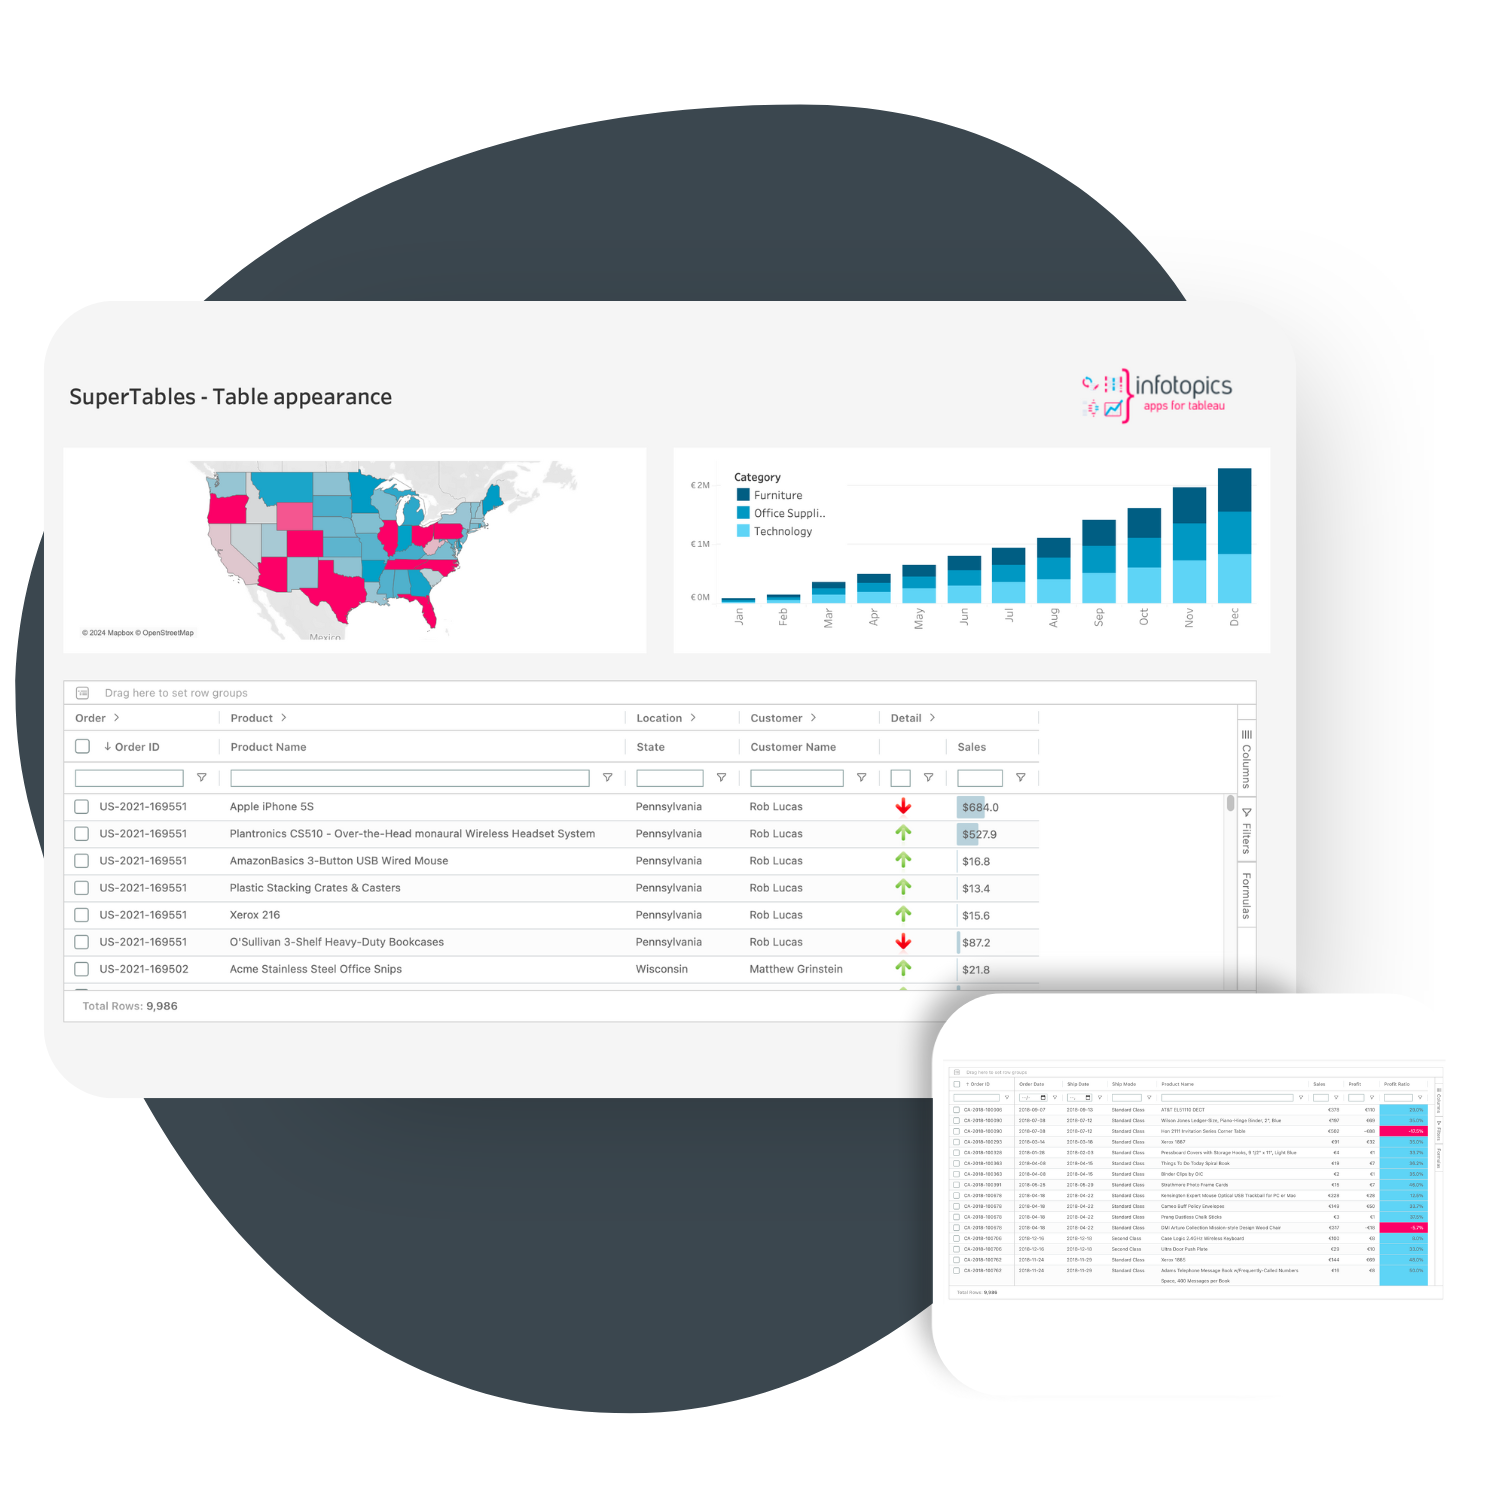
SuperTables
Flexibility, interactivity, and control without leaving Power BI.
Features.
Data Calculations
Aggregate Calculations
With this simple Calculation editor you can easily perform simple mathematical calculations which use operands like Add, Subtract, Divide and Multiply.
Front-end Formulas
Build new columns on the fly with Excel-like formulas, right inside your Power BI. Calculate values from your existing data without leaving your analysis flow, and make your tables more insightful.
If-Else Formula Builder
With SuperTables, you can use familiar Excel-style IF/ELSE logic directly in Power BI. This powerful feature lets you build dynamic tables that automatically show the right values based on conditions you define.
Date Calculations
Perform flexible date-based calculations directly in Power BI, without the need for complex scripts or switching tools. Combine dates and numbers to calculate time between events, days remaining, or total durations.
Filtering and Organization
Inline Filter
SuperTables comes with an extensive set of built-in column filter types. You can also filter by all columns simultaneously with quick filtering.
Filter Pane
Use the dropdown to choose which filter you wish to use and use the text box that will show up to dynamically filter your chosen column. You are able to do multiple filters at once.
Formatting and Layout
Conditional Cell Formatting
SuperTables lets you format the cell based on its value. Customise the background color or the text color, or even display a bar chart background to spot data differences at a glance.
User Restrictions
Use this tab to control user actions in SuperTables, deciding what they can and can't do like export to Excel, inline filtering and column sorting.
Custom Themes
Color your headers, text, borders and background to the theme you and your users recognize!
Table Structure & Interaction
Pivot Your Table
Empower your advanced users! Let them make columns out of values by pivoting on the data right in your table, similar to Pivot Tables in Excel.
Autosize Columns
Just one click and the width of your column will fit the content it contains. Get enough space to watch your data!
Column Order
Click, drag and drop any header along the columns to change the order.
Hide Columns
Columns can be hidden or made visible again via the columns option in the sidebar of SuperTables.
Full Drill-Down
The drill-down option of SuperTables allows your users to expand rows and have an additional grid with different columns inside for further analysis.
In-Cell Visuals & Composition
Export & Sharing
Control user actions in SuperTables, deciding what they can and can’t do.
- Set up URL Actions to launch links directly in the browser.
- Customize SuperTables’ export settings and apply restrictions for file formats.
- Tap into a streamlined configuration screen for in-depth customization.
- Speed up tasks with handy keyboard shortcuts.
- Display tailored notifications for empty data sets.
- Choose from ready-to-use themes or tweak details to align with your brand.