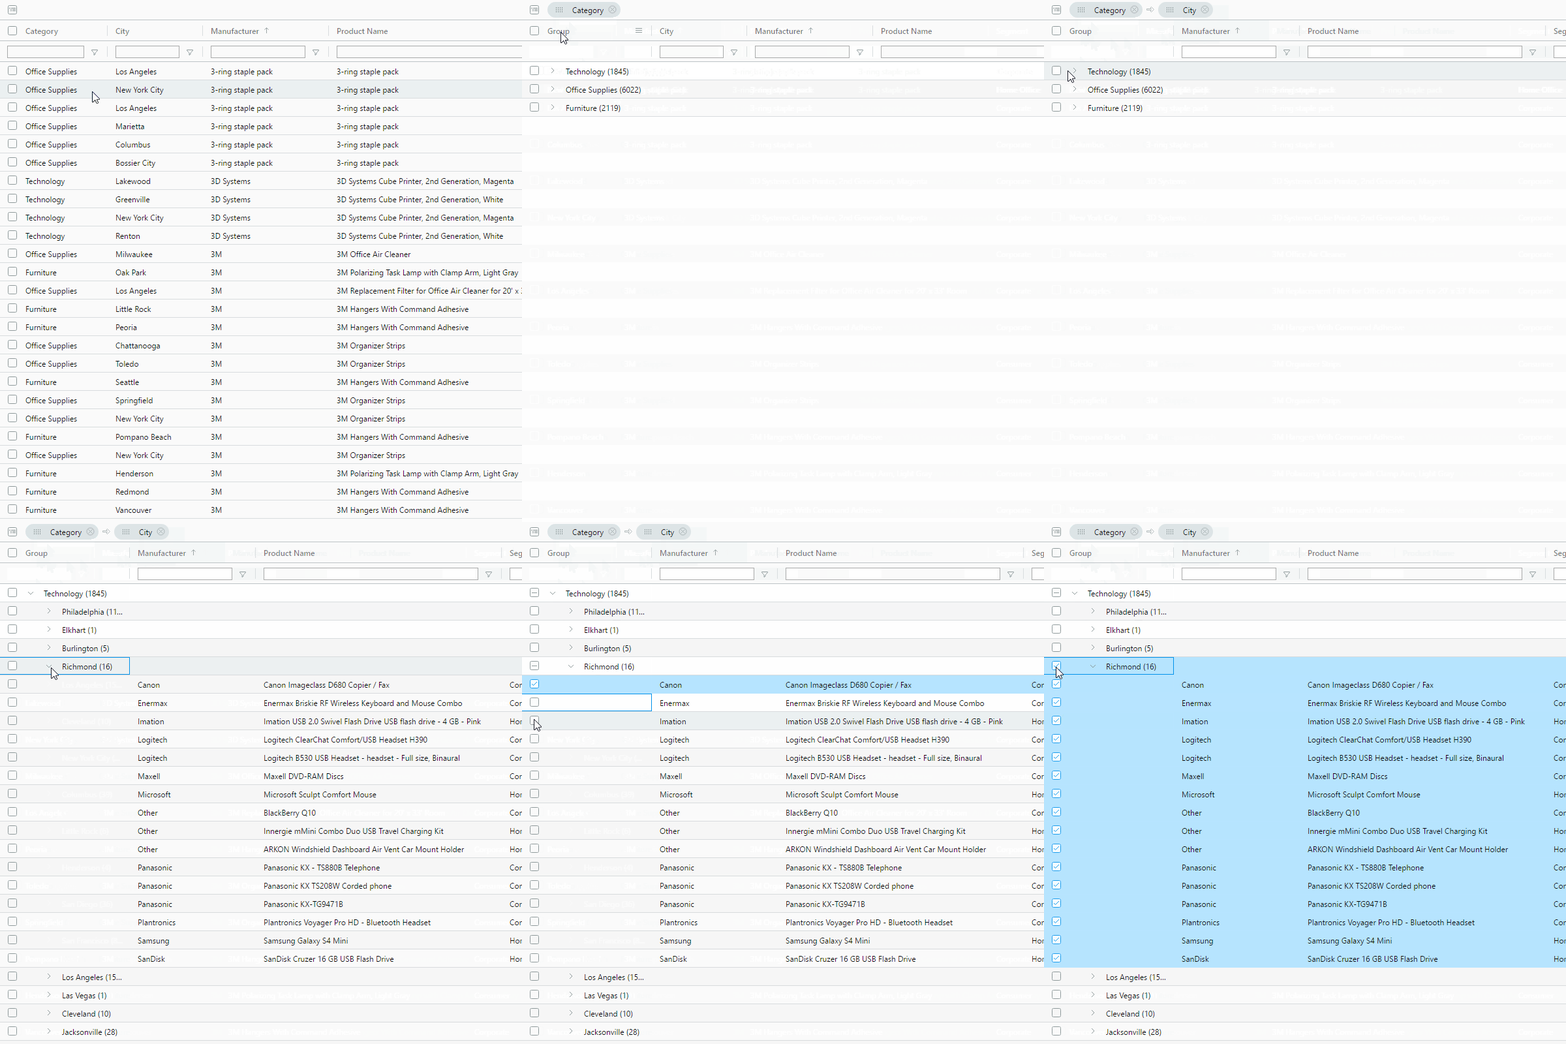
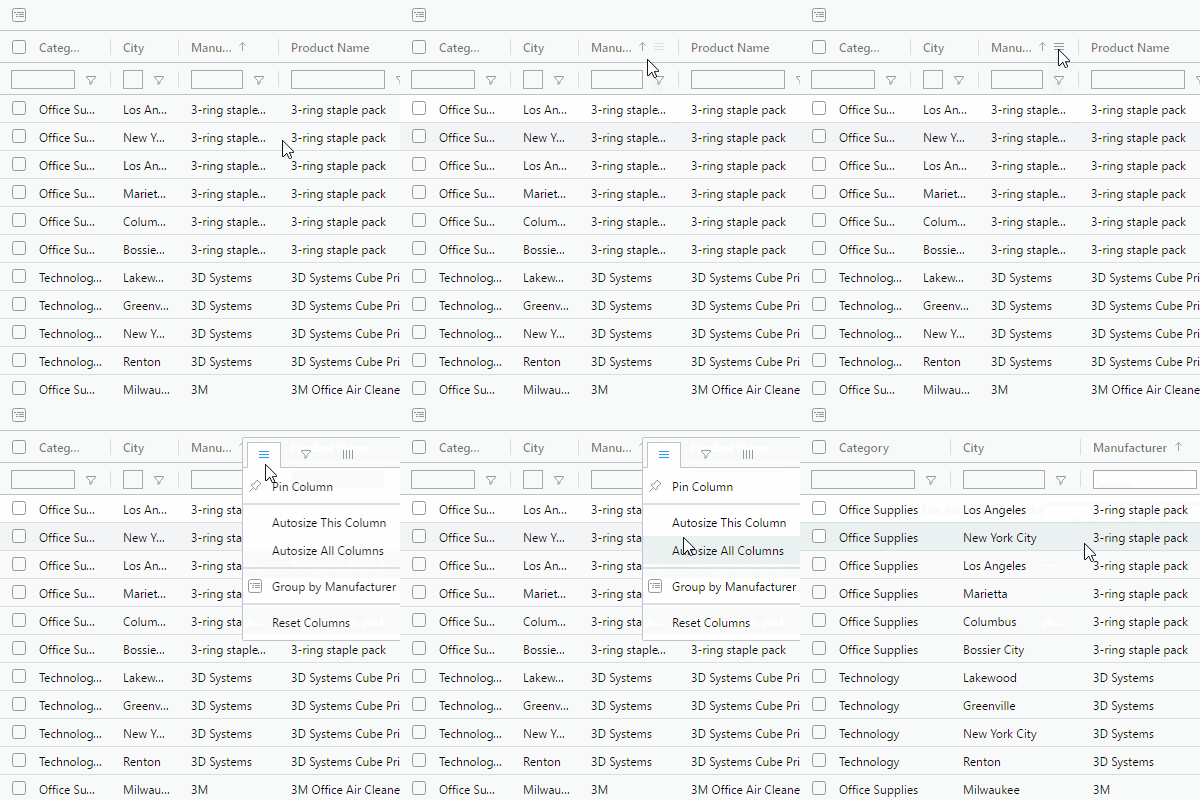
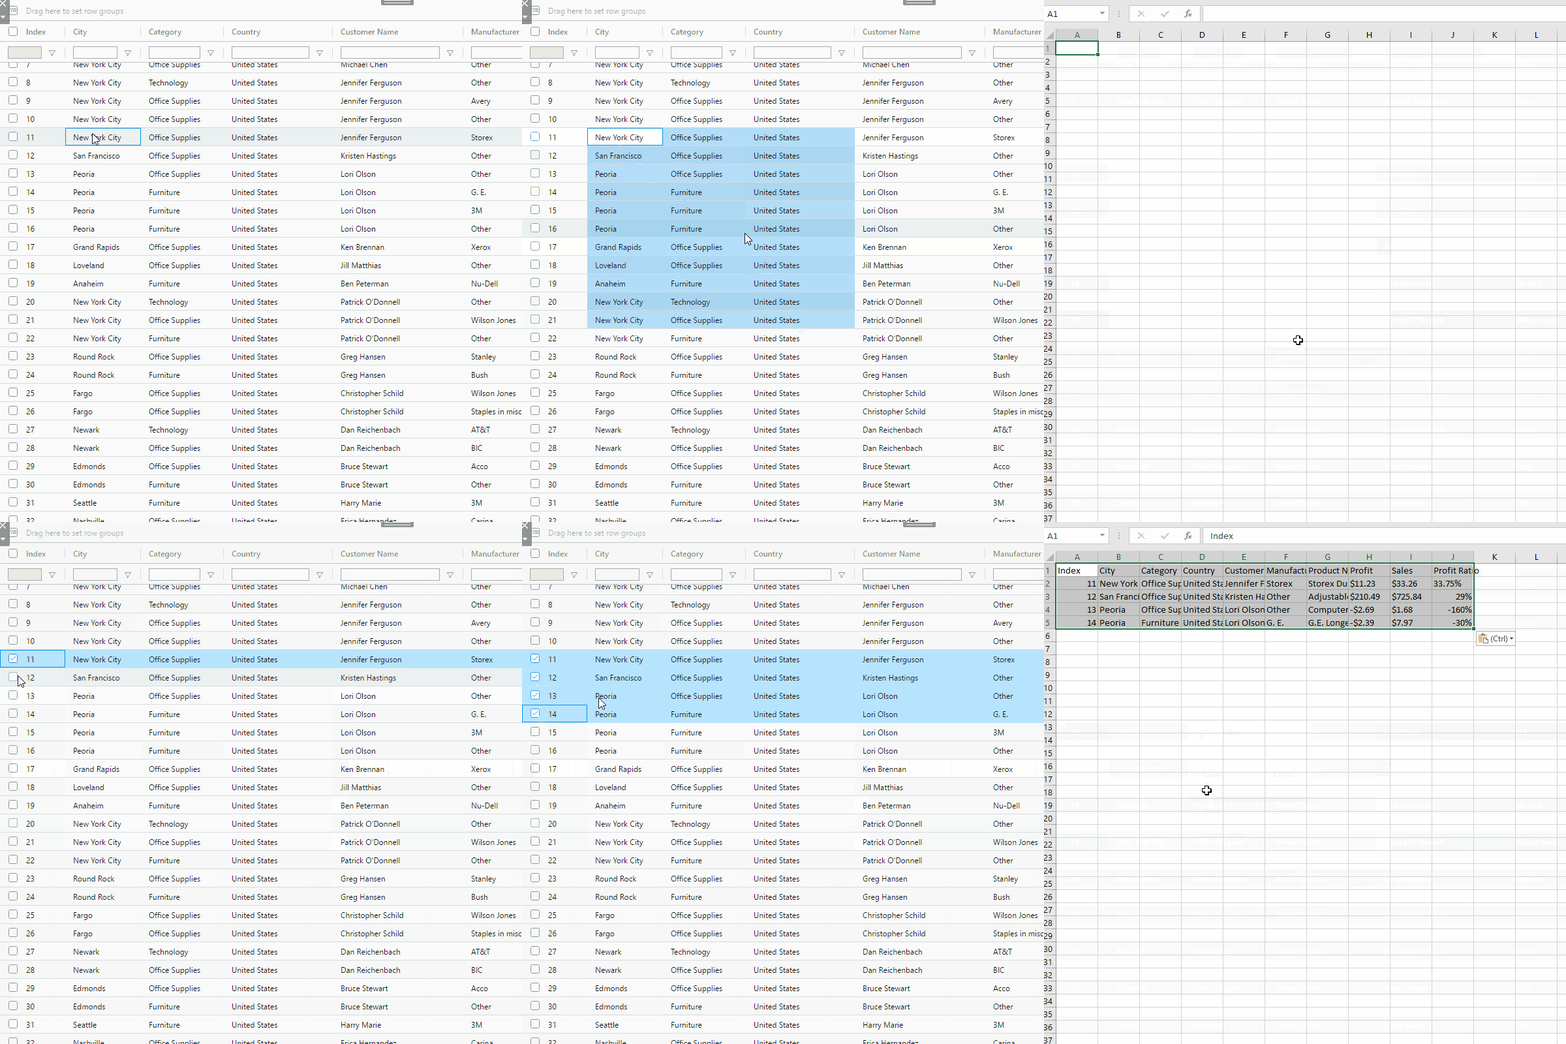
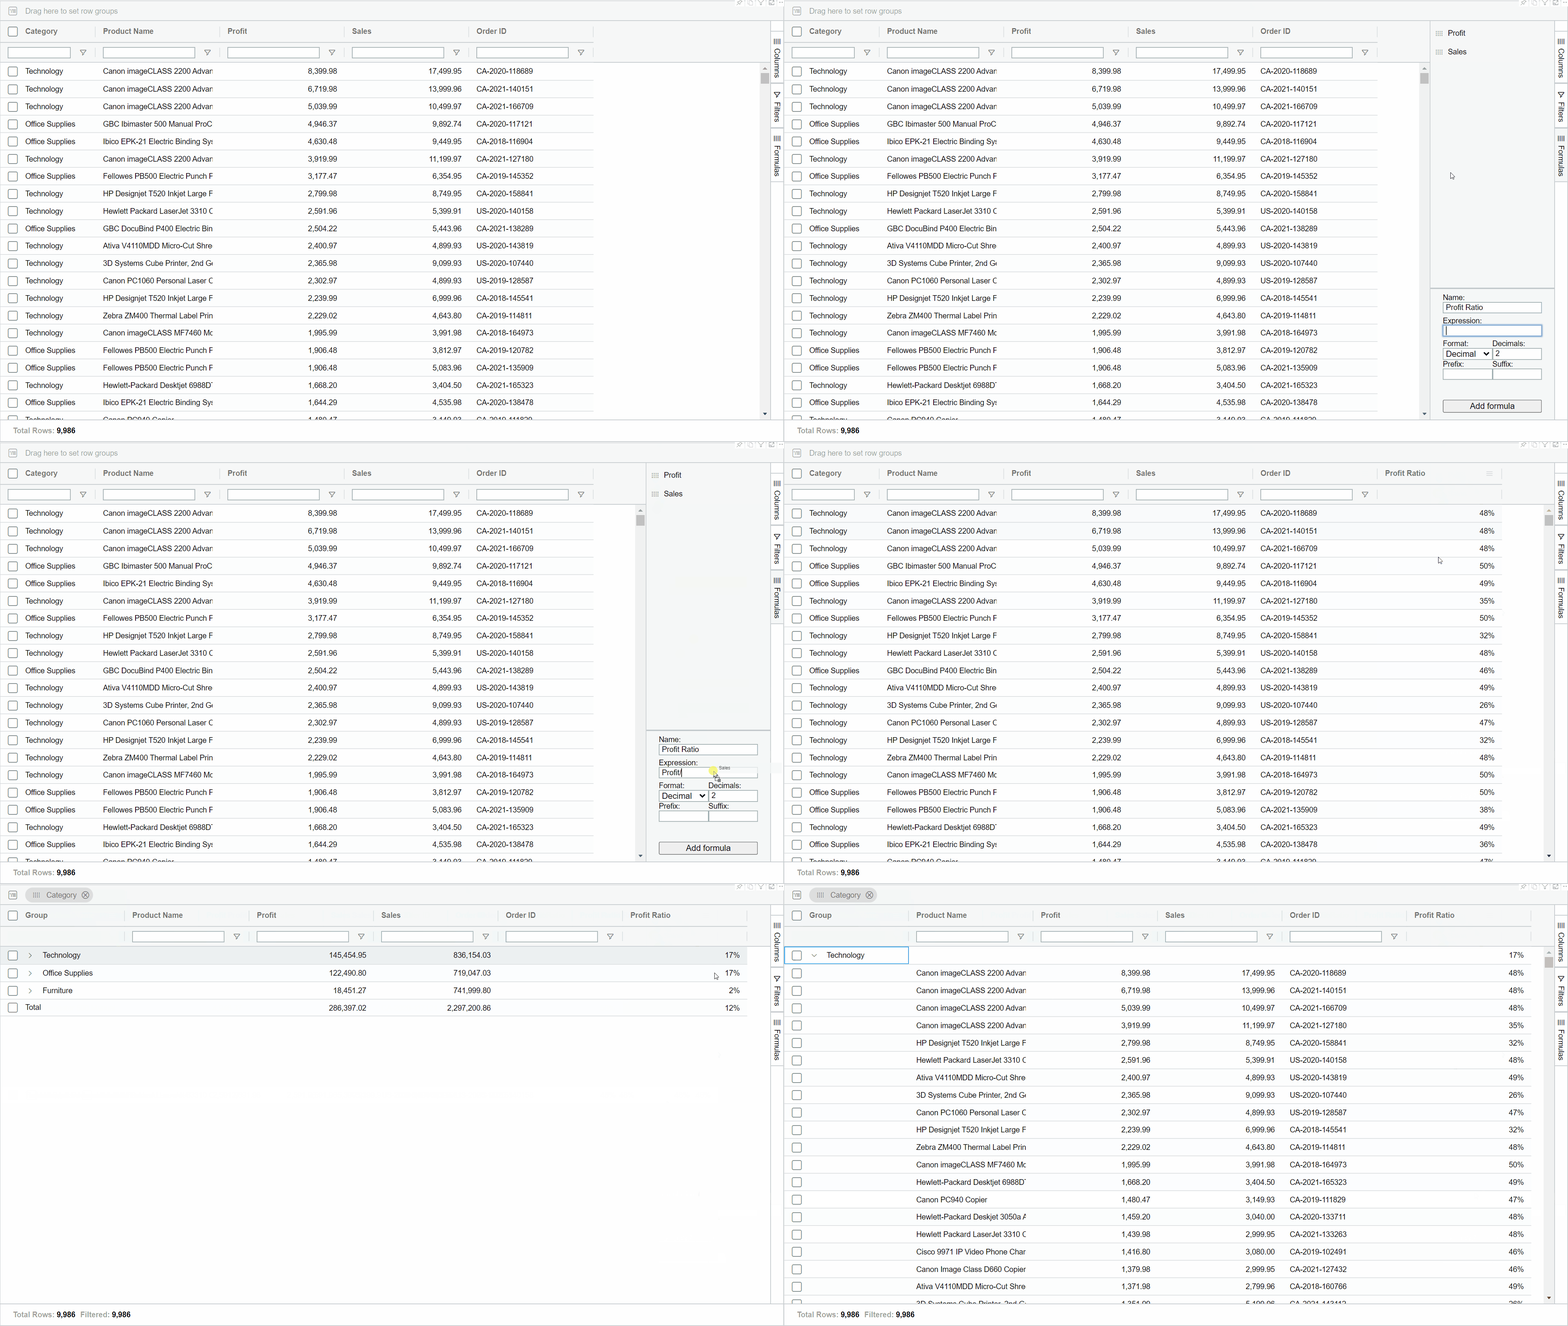
Offer viewers the power of interactive and dynamic Excel-like tables and allow them to decide how to organize and analyse their data in a flexible grid without leaving Power BI!
Every now and then we all use tables in our Power BI reports. Power BI tables offer great general functionality, but when it comes to custom grouping, ordering, or pivoting, they lack the power and freedom for the viewers.
People are very eager to work with Excel because it offers different views, makes changes, and works flexibly. Once your data is in Excel, you’re not in control of it anymore because people can share it with everyone, which can cause decisions based on incorrect data.
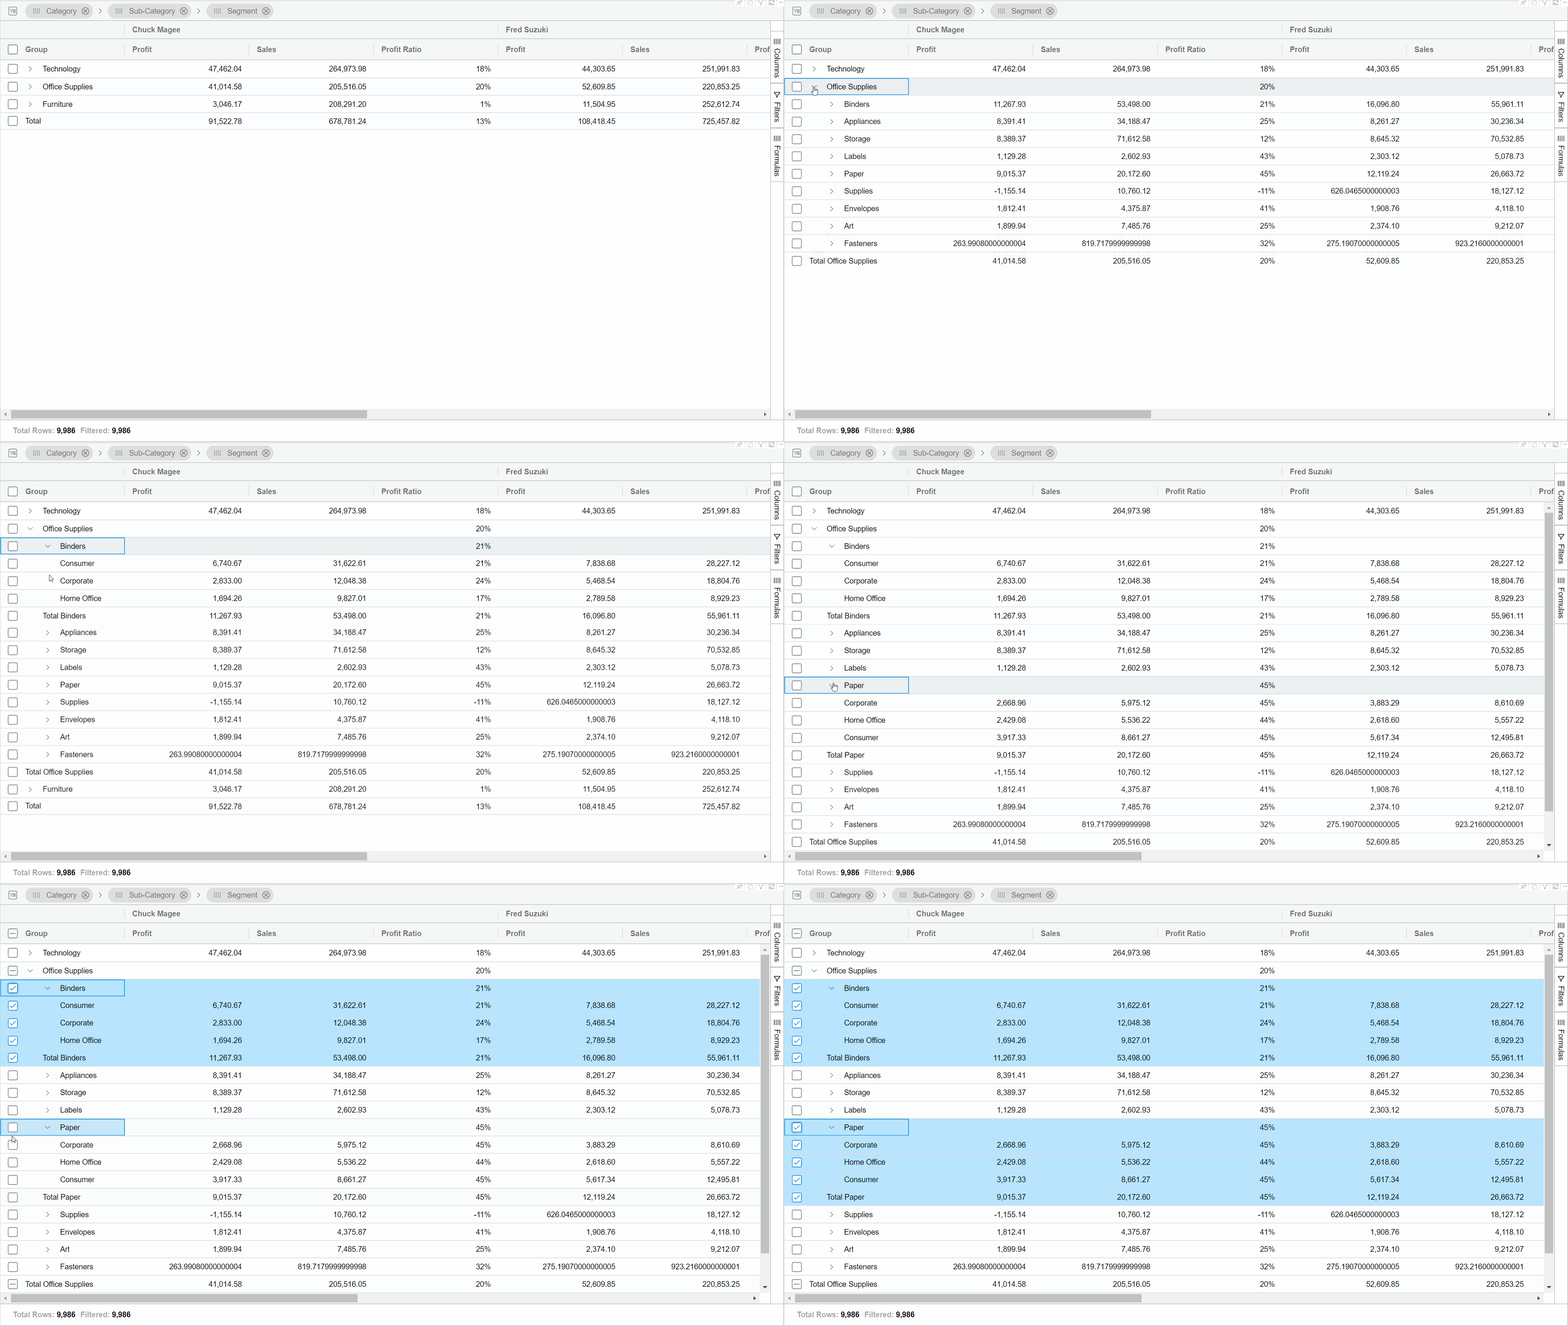
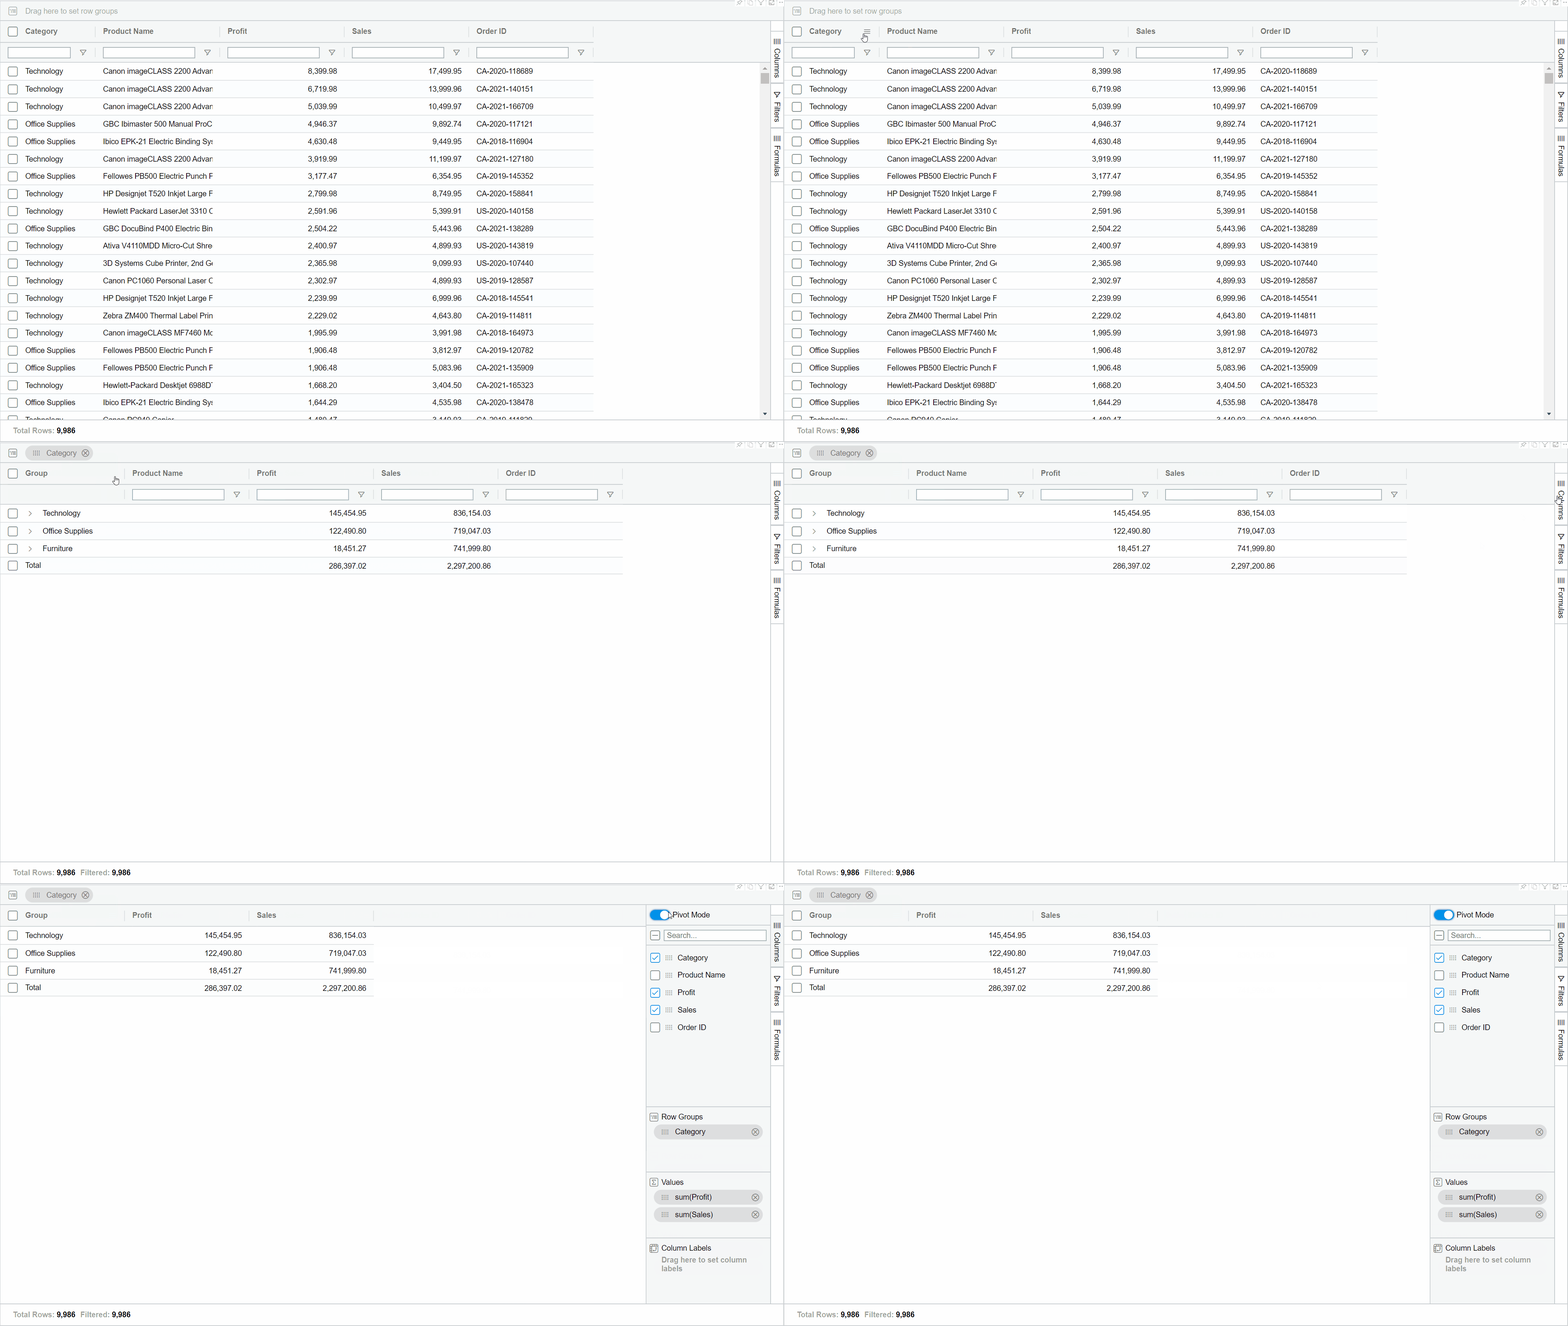
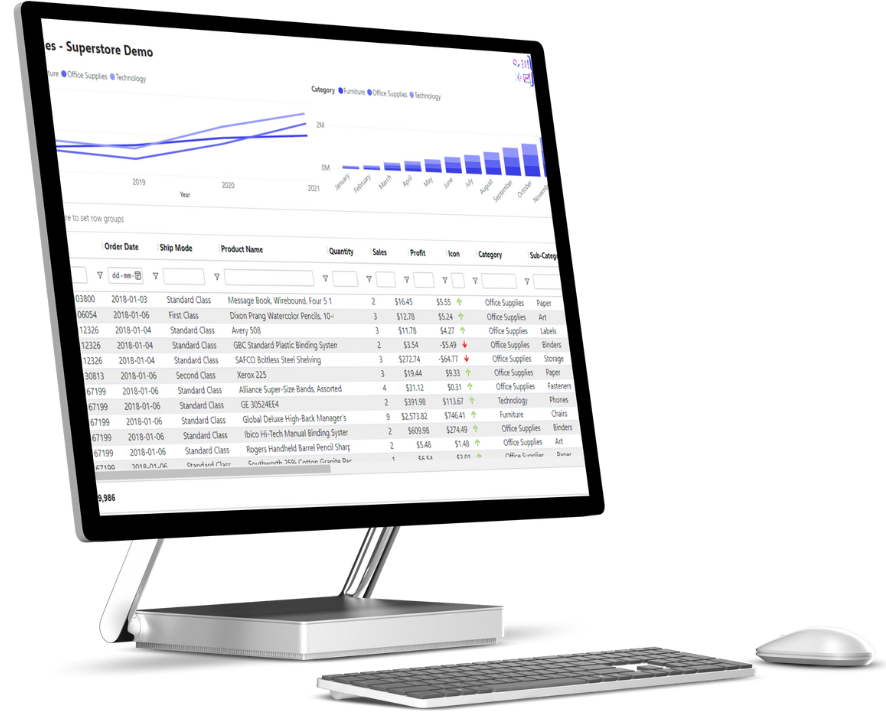
With the SuperTables visual, you offer your viewers a flexible Excel-like data grid in a report in a governed and secured way. Slice and dice your data and tables, create your own hierarchy, drill down, hide tables, group, add images, sort, and pivot, all in a user-friendly and intuitive way.
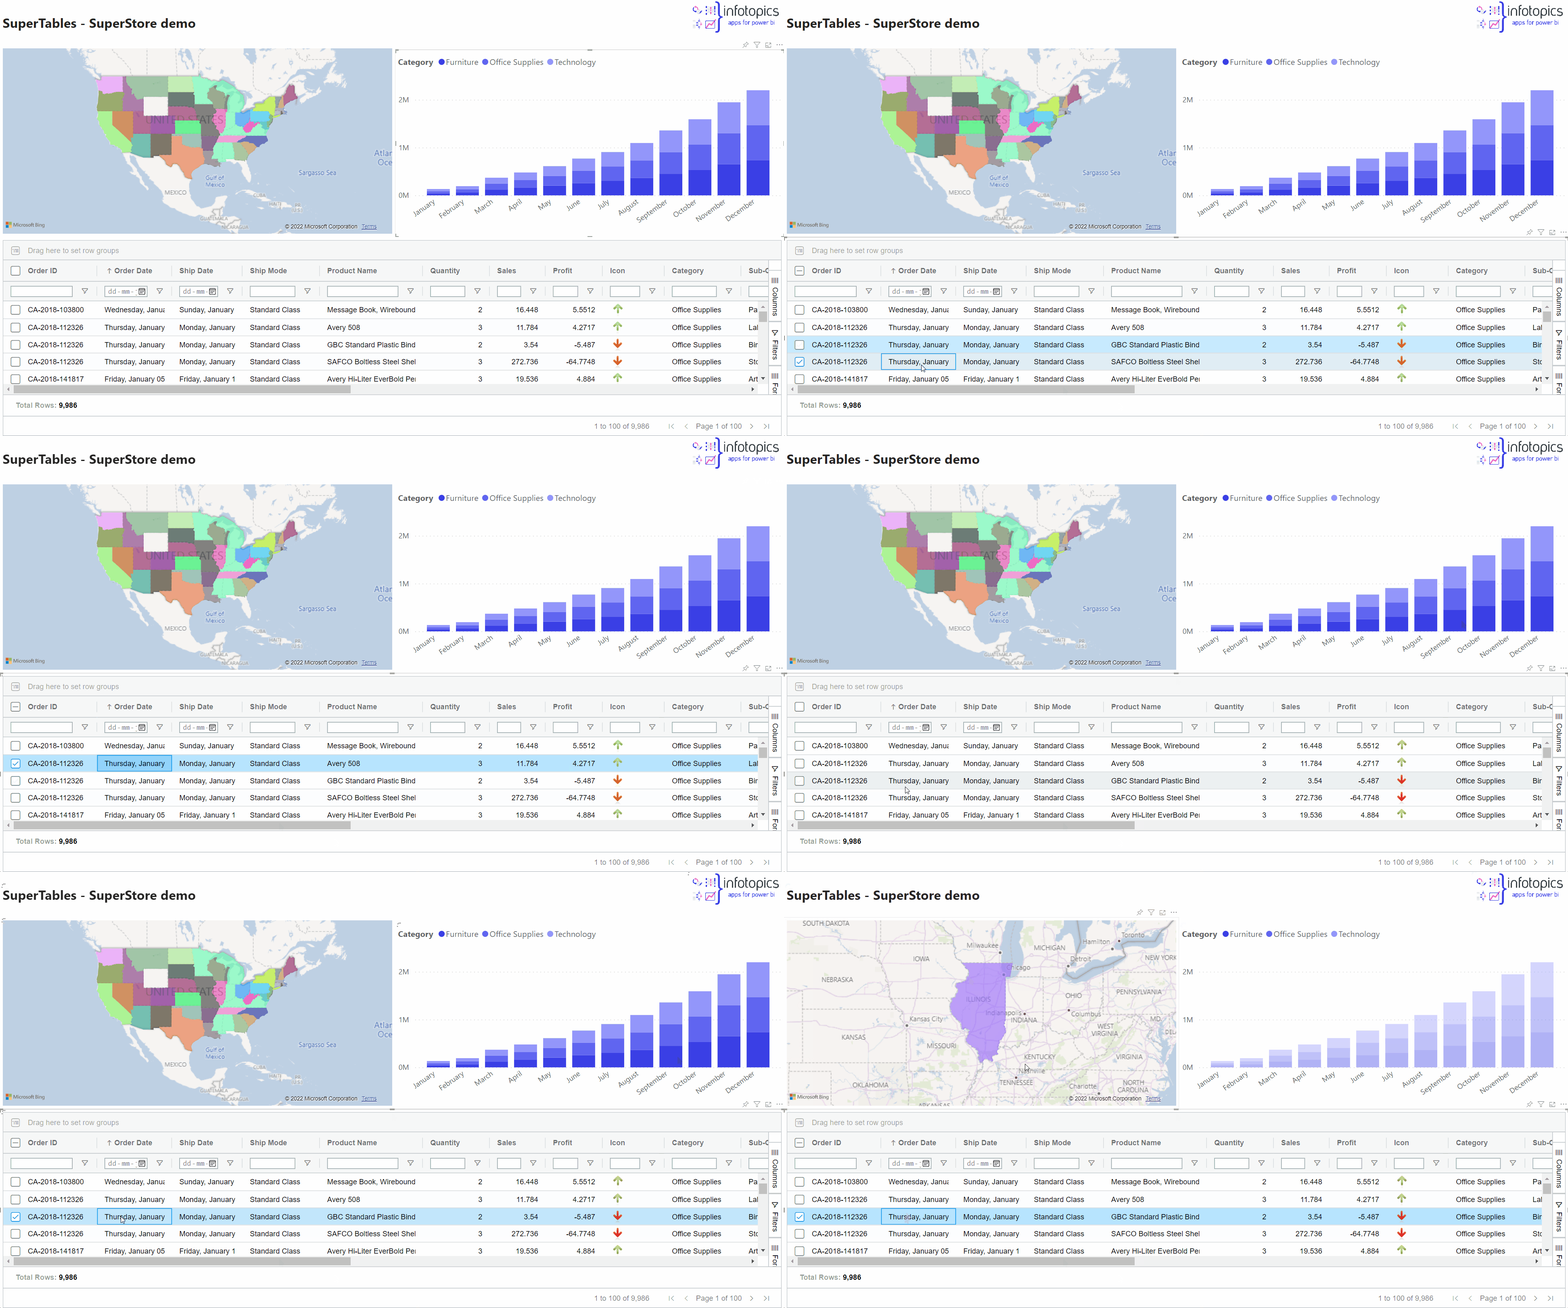
Everything is in the report; you no longer have to worry about data flying around. People with access to the report can use SuperTables, whether you’re a creator or a viewer. It’s made for you, and you decide what you want to show. Enrich your reports with the SuperTables visual for Power BI and allow your visitors to do their own analysis with the summarized data of your visualizations. Analyzing data has never been easier, more governed, or secured.
“I love how you can change the layout of the table with dragging and dropping.
And how easy it is to create a pivoted table. Super flexible!”
Countless features
There is more!
- Filter, Parameter and Highlight Actions
- Header grouping
- Prefix and suffix
- Tooltips for headers
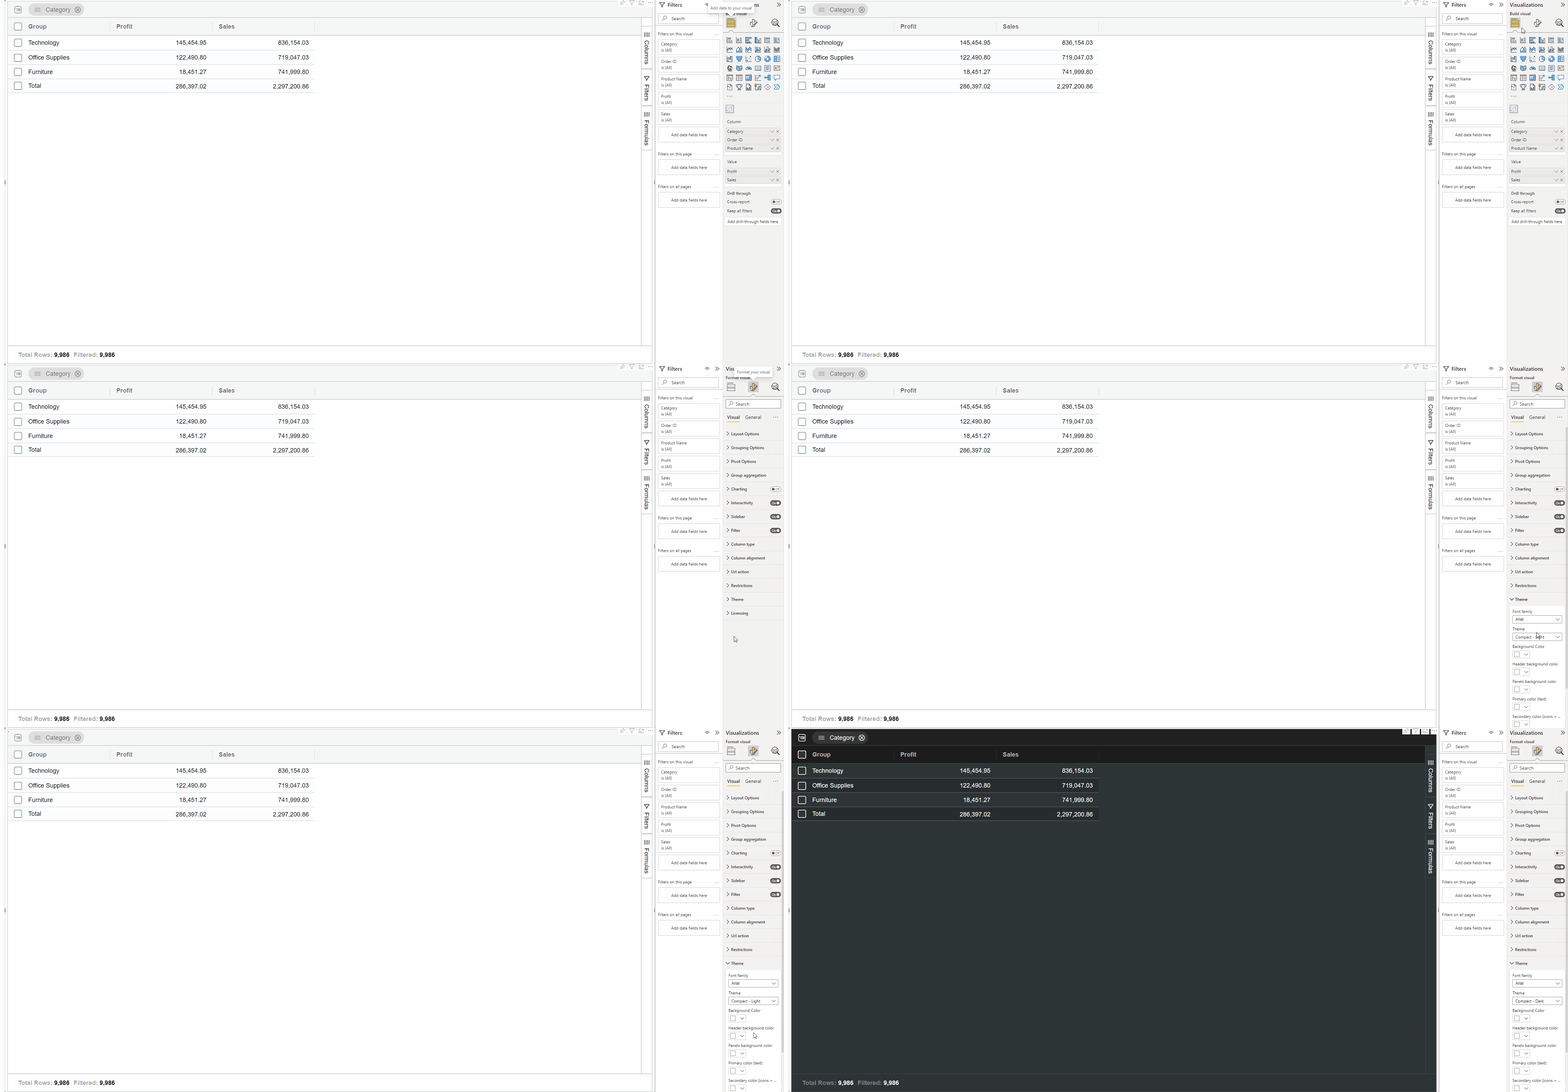
Using a table in your Dashboard comes in handy if you want to provide your viewers with extra context on their visualization. Drag the SupertTables visual to your report, configure the data(sheet) to feed the table and provide your viewers with some amazing details. You’ve never seen a more powerful Table!
Free
- Free – Limited to 100 rows
- Microsoft AppSource
- Power BI Desktop
- Power BI Service
- Power BI Mobile
- Always up to date
- Requires internet access
- Instant Download
- Cloud based / hosted by Microsoft
- Support by ticketing system
- –
Enterprise
- User based license
- Microsoft AppSource
- Power BI Desktop
- Power BI Service
- Power BI Mobile
- Always up to date
- Requires internet access
- Instant Download
- Cloud based / hosted by Microsoft
- Support by ticketing system
- Suggested row amount: 30k
Embedded
- Custom embedding license
- Contact for info
- Power BI Desktop
- Power BI Service
- Power BI Mobile
- Power BI Embedded
- Requires internet access
- Personal Enterprise portal
- Cloud based / hosted by Microsoft
- Personal enterprise support
- Suggested row amount: 30k

Governed and Secure Products
All our products are secure as we comply with ISO 27001 and NEN7510. Your data and user access is secured under Power BI’s governance. Our products are 100% secure on premise or private cloud deployed and facilitate your workflow in Power BI, eliminating the need to move to external programs.

