SuperTables Legacy Product Guide
The main use case for SuperTables Legacy is to offer more flexibility to your viewers in handling tables in Power BI. Using a table in your reports comes in handy if you want to provide your viewers with extra context on their visualization or let them make their own groupings, filtering and cross sections. SuperTables Legacy provides your viewers with a table that supports inline filtering, pivoting, grouping and many more features of which they can create their own personalized views. Drag the visual to the page, select the fields that you need to feed the table and you’re ready to offer your viewers Excel like functions without leaving Power BI! You’ve never seen a more powerful table!
We recommend to use a maximum of 30k rows for optimal performance. Anything above 30k rows makes the visual slower due to limitations from the Microsoft API.
Enter text into the search box underneath the column header you wish to filter. This will instantly filter inline and can be done on multiple columns simultaneously and offer your viewers the most flexible way of filtering their rows based on column values. To enable Inline Filtering, open the format pane within the visual. Set the Filter to “On” if you wish to have an inline filter.


Click, drag and drop any column header outside the container to remove that column from the view. The column can be made visible again via the columns option in the sidebar of SuperTables Legacy.
SuperTables Legacy Features
This section describes the flexible ‘Excel like’ features SuperTables Legacy has to offer for your viewers.

In the Sidebar on the right side of your SuperTable Legacy, you also see a “Filters” tab. When you open this tab, you can click on any column header and filter through the filter pane. Use the dropdown to choose which filter you wish to use, and use the text box that will show up to dynamically filter your chosen column. You are able to do multiple filters at once.
An amazing feature of SuperTables Legacy is that it allows your viewers to create their own grouping hierarchy. This can be done without the need for a Power BI fixed hierarchy and in any order your viewers would like. To use this feature, just drag a column to the grouping bar and drop it in the grouping bar. The rows will now be aggregated based on the grouping which you can select yourself. You can use multiple levels of grouping to create your own hierarchies just by adding columns to the grouping bar.


Format pane
This section describes the configuration of your SuperTable. In the Format pane you can change a lot of settings.
Layout options
Multiple Row Selection
When using devices where Ctrl and Shift is not an option, turn on this feature where each click of a row will keep all rows selected. Clicking on a selected cell will deselect the row.
Enable/disable status bar
This option lets you toggle the visibility of the status bar in your SuperTable. The status bar is shown in SuperTables at the bottom and holds information on the total number of rows and filtered rows..
Rearrange supertables from right to left
With this option it is possible to rearrange their SuperTable for it to read from the right to the left of the screen.
Always show sorting icon in header
Enable/disable pagination
Enable auto row height based on the contents of the cells
Enable compact mode
Make supertables compact for a clean and concise look, a very useful feature for clean-looking dashboards
Grouping options
Enable Group bar
Show or hide the grouping bar in SuperTables Legacy. This enables or disables your dashboard users to do custom groupings on the dataset you offer in your SuperTable instance.
Enable group totals within each group level
Each level will show a total of the group. Below, an example of the group total for “Office Supplies”:
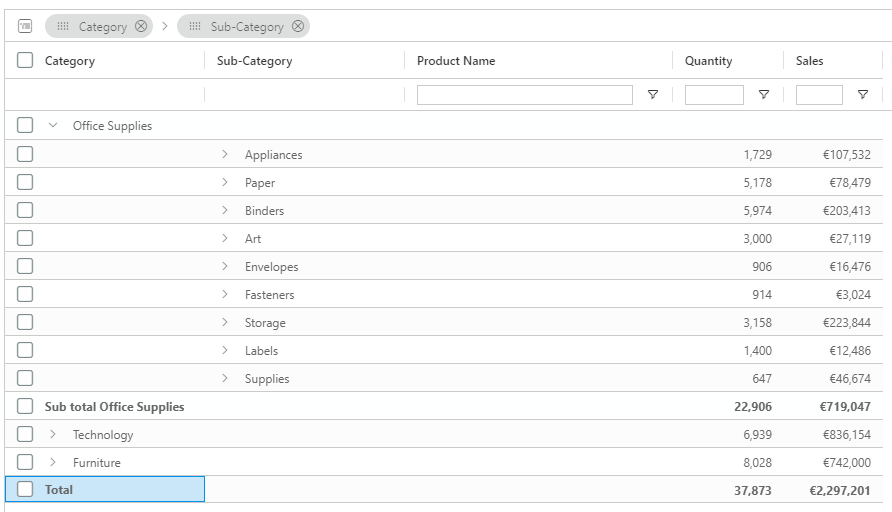
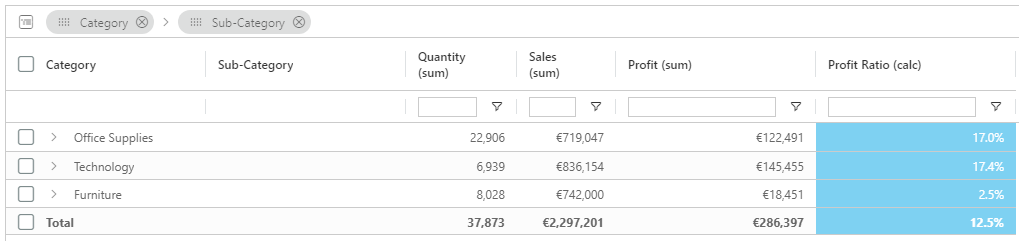
Enable a ‘grand’ total across all groups
Show a grand total of all groups in your SuperTable view.
When Group is expanded, hide the parent row
SuperTables allows you to hide the parent row while drilling down in your table. Below, an example with the parent row enabled:

Also an example with this option set to hide the parent row:

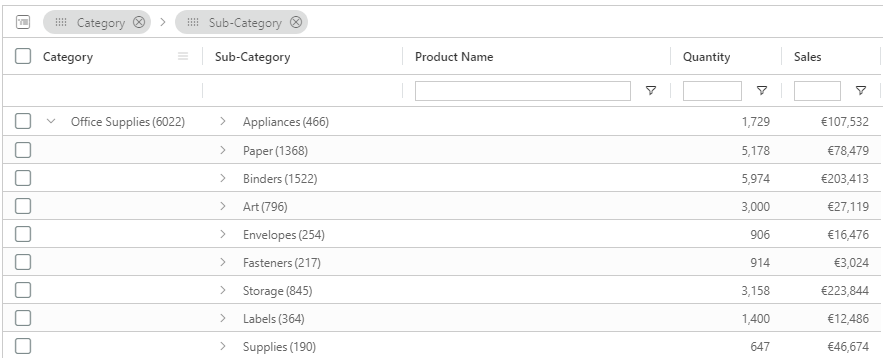
Hide the number of rows counter behind a group row
Normally, SuperTables shows the number of rows contained in a group or aggregation. With this switch you can turn off this row counter. By default, SuperTables shows a row counter when grouping:
You can switch this off and then the SuperTable groupings look like this:

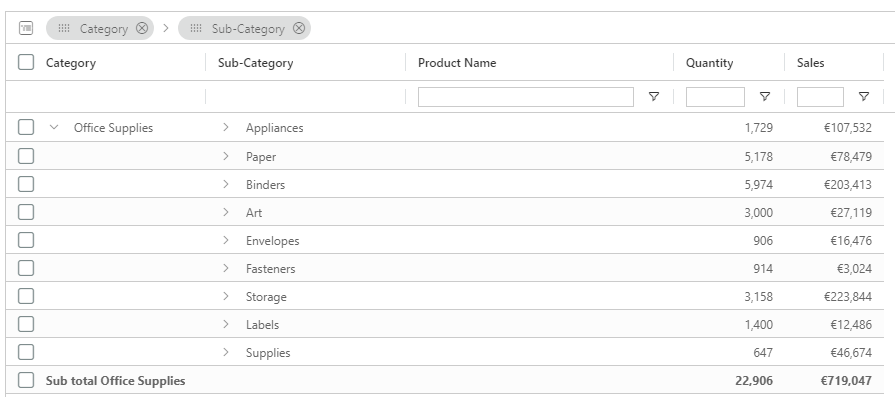
Use multiple columns for grouping
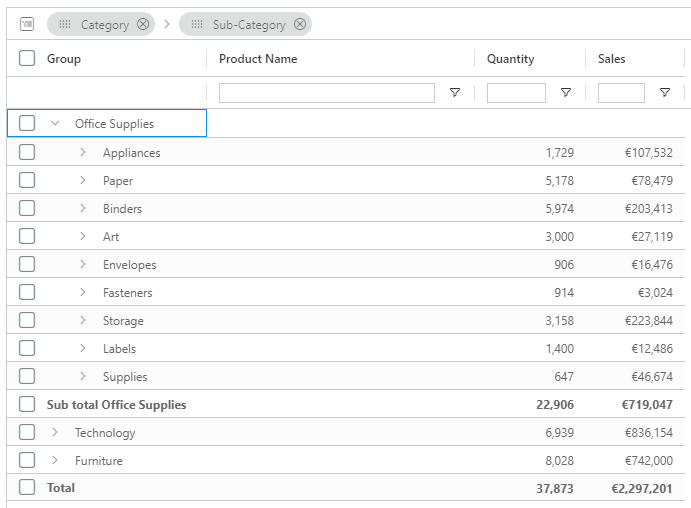
When you use the grouping bar, SuperTables uses one column for the group by default. With this option, you can force SuperTables to use a dedicated column for each member of the grouping hierarchy. Example: Below you see a custom group of “Category” and “Sub category” where there is also a separate column for “Sub category”:
Default SuperTables combines the grouped dimensions into one column called “Group”:
Show aggregation function in header
When using Measures in your SuperTable, the aggregation of the column can be shown in the SuperTable column header using this switch:
Automatically expand grouped rows
If your SuperTables has multiple groups, you can set it to open on a specified level by default. If you have, for instance, 3 group levels, you can choose to expand it by default on the first level by setting this value to 2.
Pivot options
Enable Pivot Header
Show or hide column headers when in Pivot mode.
Enable row total columns for each value at end of pivot table
Enable or disable row total columns for each value at the end of the pivot table.
Charting
Create a pop-up chart of your selection. Within your SuperTable, select some dimensions and measures, right-click and choose ‘Chart Range’. Here, you will be presented with a selection of charts. Click on your desired choice and you will be presented with a pop-up chart within your dashboard. This is read-only and will not be stored in your SuperTables Legacy configuration and settings. It is designed to help your viewers with some extra self-service analytics on the SuperTables Legacy data.
Interactivity
Do you want to have a interactivity with an other visual? Turn this function on!

Sidebar
Enable/disable sidebar
Enable the option to show or hide the sidebar in the SuperTables Legacy visual for Dashboard users. You can also individually set this option for only the
- Columns panel
- Filter panel
- Formulas panel
Filter
Do you want to have a filter field for each column? You can set the field type in this section to filter text, numbers and dates
Column Type
Text
Default columns are set to image, they will get the type out of Power BI.
Image
Does your dataset has an image? Select this option and you can see your image in SuperTables Legacy!
HTML
If you’re dataset has an html inside it, show it like this with the column type HTML
Markdown
If you’re dataset has a markdown inside it, show it like this with the column type HTML
Emoji
Why not use some emoji in your table? Use Unicode to set some emoji in SuperTables Legacy
Column image settings
Add the width and height in px in to the text boxes.
Enable ‘auto row height based on cell content’ under the Appearance tab to enable larger images in the grid. We suggest using square images for better layout control. Leave width and/or height empty for auto detection.

Column alignment
Choose the alignment of the text within your SuperTables Legacy view.
URL action
Entering a URL will allow users to click any cell in this column to open a new tab in their web browser. You refer to any other value from the same row of data by wrapping the field name with angle brackets. For example

Restrictions
Use the this tab to decide what the users will be able to do once you publish your report. By default, there are no restrictions set in SuperTables Legacy. If you decide it is better for your use case to restrict people from some of the SuperTables Legacy functions, you can set it up in this configuration. screen. User can adjust column width When creating a pixel perfect dashboard, you might want to fix the column widths in your SuperTable. This option prevents your viewers from changing the column width. User can sort columns Some use cases require a strict sorting of the columns in your SuperTable. This option helps you maintain that sorting by preventing the viewers to change the column sorting in your SuperTable. User can order columns Some use cases require a strict order of the columns in your SuperTable. This option helps you maintain that order by preventing the viewers to change the column order in your SuperTable. User can anonymize data You can either allow or deny your viewers to use the Anonymize function of SuperTables Legacy. User can Copy data The great thing of SuperTables Legacy is that you dimmish the demand for working with Exce However, SuperTables Legacy allows users to copy selections of rows/cells to the clipboard by default. This option can prevent your users to copy the data of SuperTables Legacy to the clipboard. If the editor wants to see what a viewer will see just use the Show user view, now you can edit everything wat a viewer will see.
Theme
Your reports are about to look even better! Our most recent upgrade of SuperTables Legacy allows creators to match their SuperTables Legacy extension to their report branding. Color your headers, text, borders and background to the theme you and your users recognize!
Licensing
Use this tab when you recived a license key from AppsForPowerBi. Copy and paste the license key and click on enter.
When you have a valide license you will see your company name and email, amount of users en expire date.

About
Here, you will find which version of SuperTables Legacy you are using and the Infotopics | Apps for Power BI website link.
We love to make solutions and help Power BI users to do things more efficiently. If you have feedback, ideas, questions or need support, please share them with us! Also, don’t forget to follow us on social media for our latest news and updates.