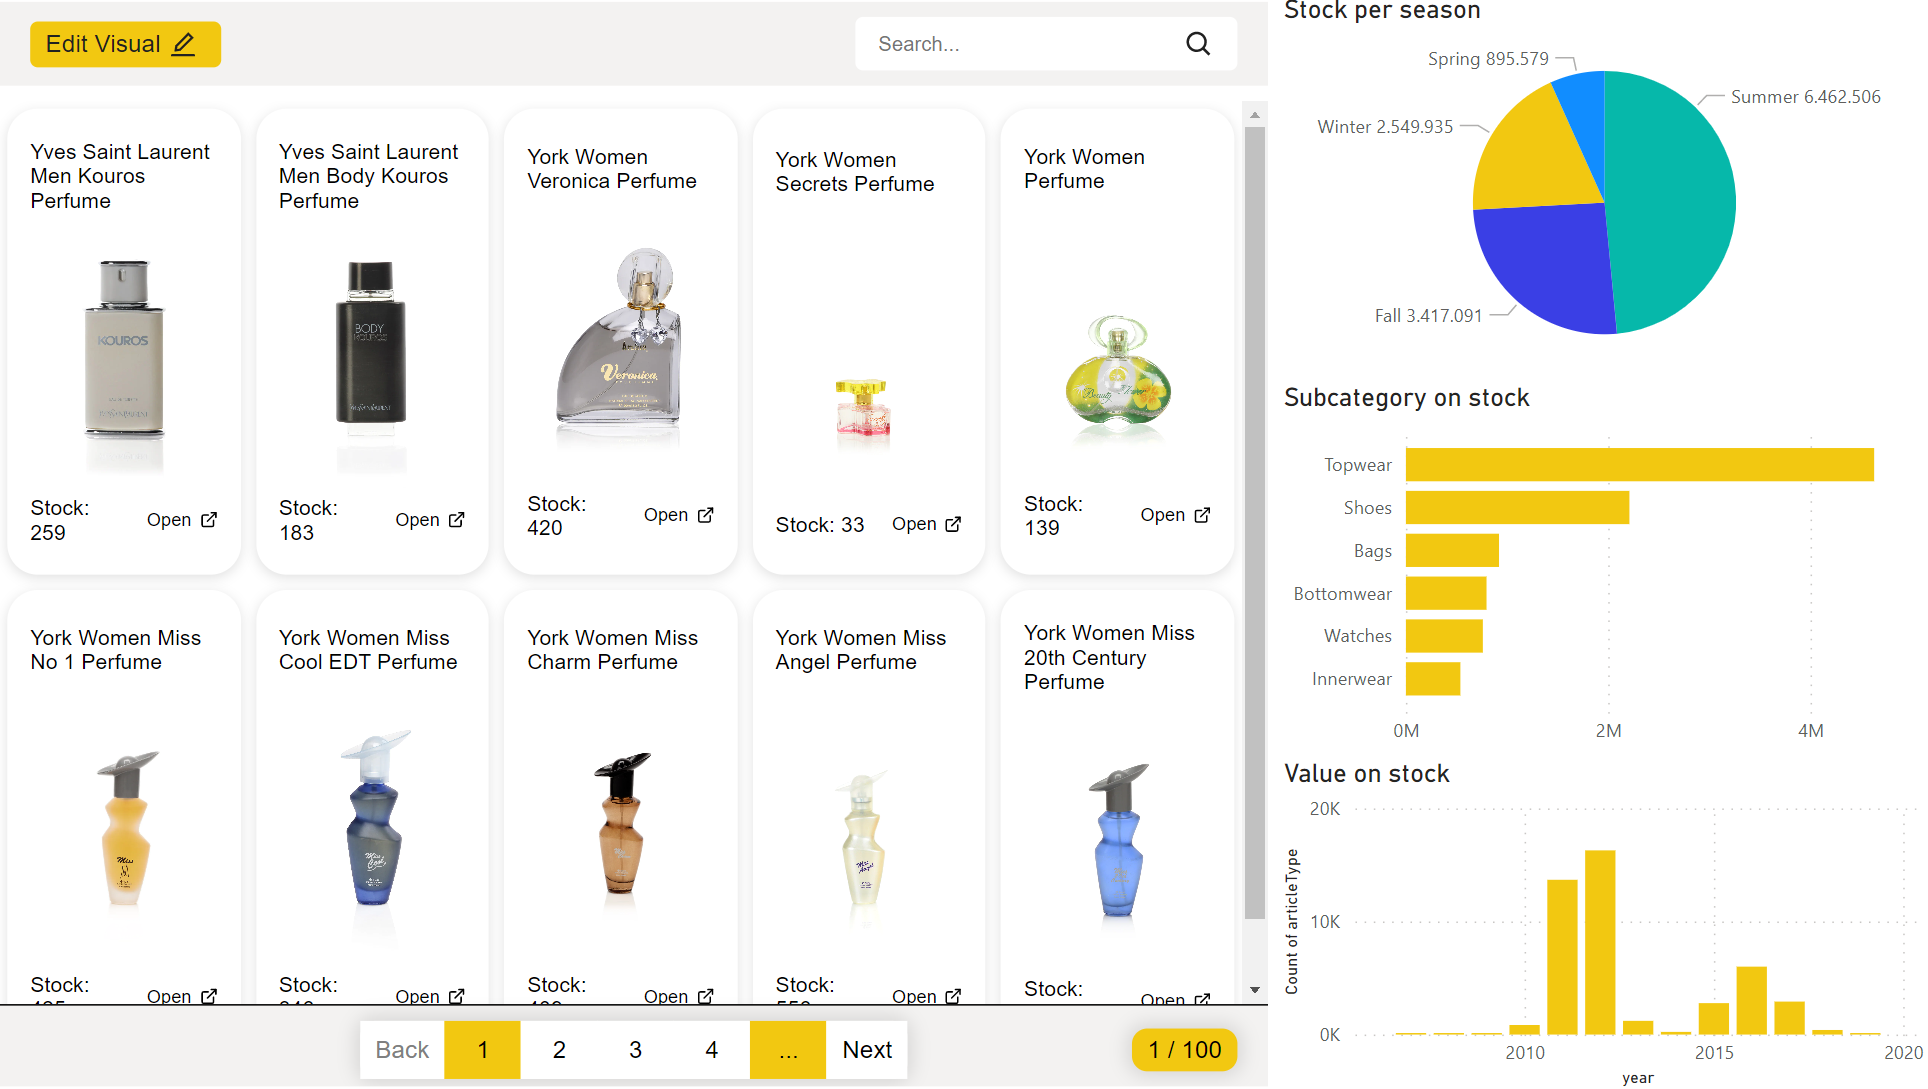
A picture is worth a thousand words. So why not use more pictures in your dashboards?
One of the biggest challenges that retail companies encounter when doing data analysis in Power BI is having only textual codes to identify products. For developers, it is time-consuming to get all product imagery prepped up and import it to the dashboard. Even when that is done, the pictures are usually of low resolution and static; otherwise, they take too much space in the workbook and slow down its performance.
There is a solution to this problem, and it is called PictureThis helps you create dynamic image tables in Power BI that can be used as a filter in your reports. You can use image URLs from your dataset to automatically create a responsive image table. These images can then act as a filter on another target sheet in your report. The best part? The images are not stored in your workbook, meaning you get the best performance! Here are some use cases from our customers:
Use Case 1 – Interactive Tables With Product Imagery
With PictureThis, one of our customers – a global fashion company – created interactive dashboards with images of their products. This dashboard is one of the most used dashboards within the company, as it ranks the daily and weekly sales by product. Once the product is selected, a secondary table opens where users can see how this specific product is performing in each store worldwide. Furthermore, they can see the available product sizes if they click on the store.
“PictureThis has helped many of our teams to save time when analyzing data.” – Data Science Project Manager.
Use Case 2 – Bridging the Gap Between Creatives and Tech.
Another one of our PictureThis customers – a retail company – was able to manage their inventory and merchandising by having real-time insights into the best- and worst-performing styles at any given moment. Having the images of the products alongside the data gave their business users the right information at the right time to make important decisions quickly.
Furthermore, PictureThis reduced the gap between creative people and the technology used within the company. Now, creatives feel much more confident about using the dashboards, thanks to the available pictures.
“Our creative stakeholders feel much more empowered when they see the products in the photos. PictureThis helps bring our data to life in a very unique and efficient way. It is a key extension that we see as foundational to many of our reports.” – BI Manager.
Use Case 3 – Building an Internal Repository of Reports.
A unique use case for PictureThis came from one of our customers – a finance company – who uses PictureThis to create a repository with reports templates that can be shared internally. For example, an employee has produced a report while doing an ad hoc analysis. Then, this report could be helpful for another employee who needs to conduct the same analysis. Therefore, the first report is shared in the dashboard as a picture, connected to a URL link that leads the user to the report template. The company has made distinguished fields for reports that are “Completed” and those that are “In Progress,” informing users of what they can already use as a template.
The repository created with PictureThis has significantly increased the data literacy within the company. It is also a great way to popularize reports by seeing which ones are used mainly by the employees. This makes people curious about reports they otherwise never would have clicked on. Lastly, the repository made working with data more efficient than ever before.
With PictureThis, our customers can create beautiful, interactive, and informative reports that can be used even by less tech-savvy employees. Developers saved hours per week in prepping up images, while business users can quickly make critical decisions for the business thanks to the PictureThis reports. PictureThis also enables unique use cases, such as the reports repository, so endless possibilities exist! Are you curious to try PictureThis in Power BI?

